Subscribe to our newsletter
Visualising Research Impact
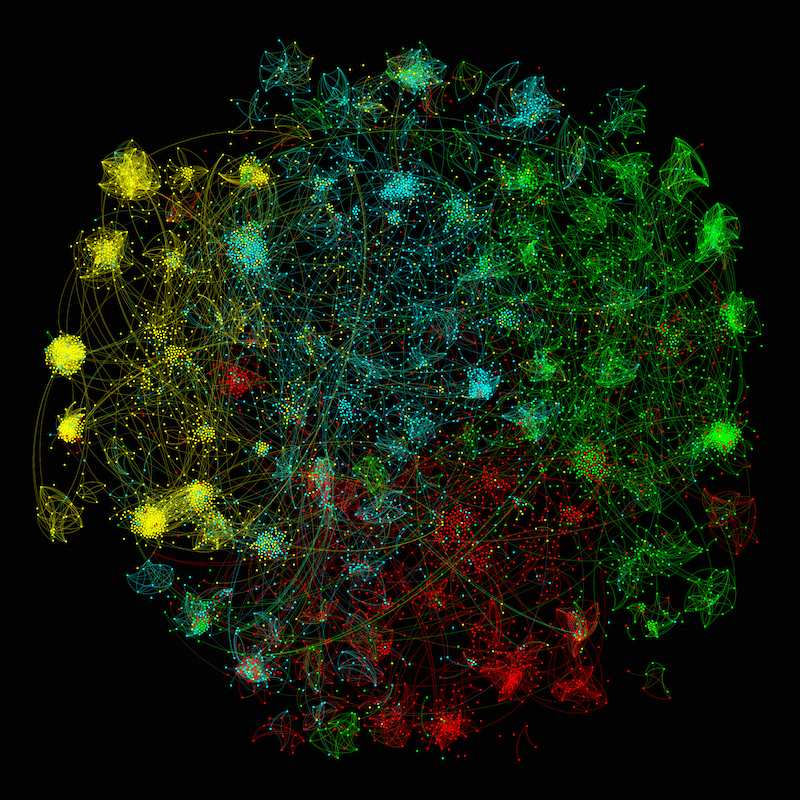
Our latest Digital Research Report, ‘The Diversity of UK Research and Knowledge’, is out today, with new visualisations of the knowledge networks underpinning the impact of UK university research (interactive network accessible here).
The UK’s Research Excellence Framework (REF2014) produced a fantastic new database of evidence about the impact of university research. In the past we have had data on research funding, training and publications. Now we can add to that the impact of research on the economy, society, the environment, health, education and across the arts.
REF2014 included a total of 6,975 case studies capturing the work of 50,000 researchers working in 154 institutions and grouped into 36 disciplinary units of assessment (UOAs) in four overarching subject panels: life sciences; engineering and physical sciences; social sciences; and arts and humanities. Each four page study included the underpinning research, details of the impact, and corroborative materials.
In 2014, the Higher Education Funding Council for England (HEFCE, which runs the REF) commissioned Digital Science to turn these case studies into a searchable database and website. We worked with the Policy Institute at King’s College London to analyse the contents and King’s produced a great overview report delving into that.
It’s a lot of data. How do you work out what’s there? Each case study focusses on priority areas in science, policy and society – but what areas? How closely are they related? Digital Science started with a detailed text analysis and then compared pairs of documents: on the website you can find click to ‘View similar case studies’.
That’s fine, but what does the network of similarity look like? The online version (accessible here) shows you the knowledge clusters, it identifies the main subject panels of of the REF that the work is drawn from, and it also allows you to go straight to each case study in a cluster to look at the research. This makes it very easy to get both the big picture and the detail that it contains.
The UOA categories are too broad to tell you much detail about the research underlying the case studies, so we also looked at the text from a different angle to see which specific Fields of Research (FoRs) the researchers were drawing on. We assigned up to three FoRs to a case study because we found that most case studies crossed disciplinary boundaries. Impactful research is usually also interdisciplinary research, sometimes on a grand scale.
The case studies are linked by FoRs they have in common, this creates a second network which we can visualise and which allows people to quickly see how research fields link to one another. The way in which the fields link up in our visualisation looks remarkably like the ultimate key to human innovation – the brain! So we have called these networks Digital Science BrainScans, and we can create a BrainScan for each university and college that makes up the underlying database.
Click on the image for the interactive visualisation: