Subscribe to our newsletter
The Donuts Are Everywhere so I’ve Already Got “Altmetric” Right? Wrong!
Wouldn’t it be nice to walk into your lab, your journal group, or your library and proclaim, “THE DONUTS ARE EVERYWHERE?!!!” Alas, it might be a bit misleading. Your colleagues might be disappointed to find you don’t mean sugar covered fried bread; but when it comes to data, it might come close.
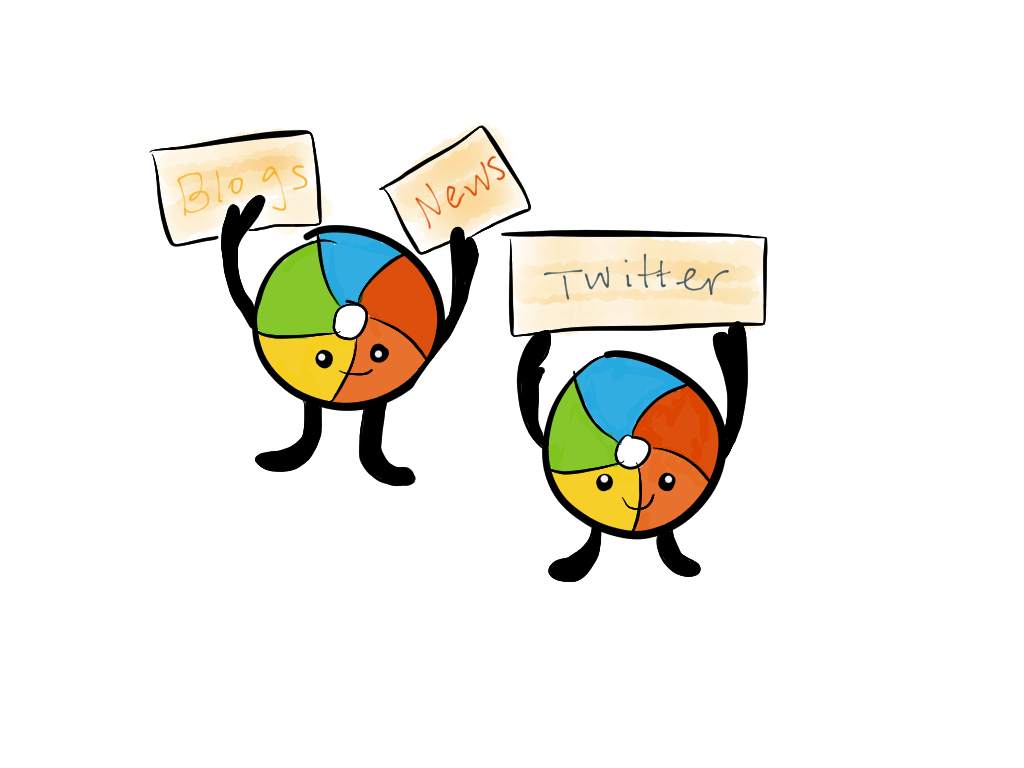
The fact is that Altmetric donuts – those ubiquitous colored swirls, bricks, or blocks found in institutional repositories, publishers’ websites, and databases – are indeed everywhere. Over 70 publishers globally (who produce research outputs ranging from books to reports to peer-reviewed articles to data) deliver this data in over 6,000 journals worldwide. Whether you know what they are, you’ve seen these “delightful” multicolored swirls enhancing abstracts and metrics pages on platforms ranging from Nature to the National Academies of Science.
Because the donuts do indeed feel like they’re everywhere – heck, the bookmarklet even works in PubMed! – many data aficionados think, “I guess we’ve already “got” Altmetric,” meaning, “I think we’ve paid for access to Altmetric data. It’s a little clunky – one article or output at a time – but there it is on the page.”
The reality is that you or your institution most likely does not have Altmetric. Rather the publisher site you’re on, the repository you’re depositing into or the research management system you’re updating have paid for you to see the donut. You can’t save or export its data. If you want to compare it to other donuts, you would have to do it manually. In short, you’re getting a taste of what the data can do. You’re still only getting a tiny fraction of a larger, richer picture that can enhance everything from grant applications to tenure and promotion dossiers.
Altmetric’s Explorer for Institutions platform– the web application that aggregates data around large groups of research outputs facilitating competitive insights, trend analysis and discovery – is the final piece to creating this 3D picture of impact. Aggregate, parse, and interrogate quantitative AND qualitative data around all the research you’ve produced including data sets and other non-peer-reviewed research outputs. Set up searches and alerts to find trending research in your field and discover new content, conversations, and collaborators in the specific mentions to your articles.
Remember our data is fully auditable. We want you to be able to read and assess the “who, what, and where” of every comment on your work – positive, negative, or neutral. While data one article at a time is great, getting all your donuts in a row is better. Want to learn more, set up a trial, or watch a quick demo? Get in touch at support@altmetric.com.
And, remember, don’t yell the “The donuts are everywhere” in a crowded library. You might get crushed.
#followthedonut @altmetric. Learn more about me @RouhiRoo.
 Sara Rouhi has worked in scholarly publishing for seven years and is Product Sales Manager in North America for Altmetric.com. She speaks and runs workshops on metrics in practice and the scholarly publishing process at library and scholarly publishing conferences worldwide. She is an active member of the Society of Scholarly Publishing’s Education Committee and currently runs their Librarian Focus Group program. She was awarded SSP’s Emerging Leader Award in 2015. Previous to working at Altmetric, she managed outreach and training for ACS Publications, working with librarians to help explain and clarify ACS Publications policies, products, and services.