Subscribe to our newsletter
Coffeetime Science: The Problem with Analyzing Large, Complex Datasets
From immunology to informatics and back
I’m sipping my placebo coffee together with Katja and Narges. It’s placebo because we have run out of regular coffee and only have decaf left. I’m sure productivity in the institute has taken a dip in the last day or two. We’re discussing a meeting we were at yesterday. “I though it was a really good discussion yesterday” Katja begins. “It’s definitely a new area for everyone, and getting a consensus on what people do to analyze their data is important”, Narges adds.
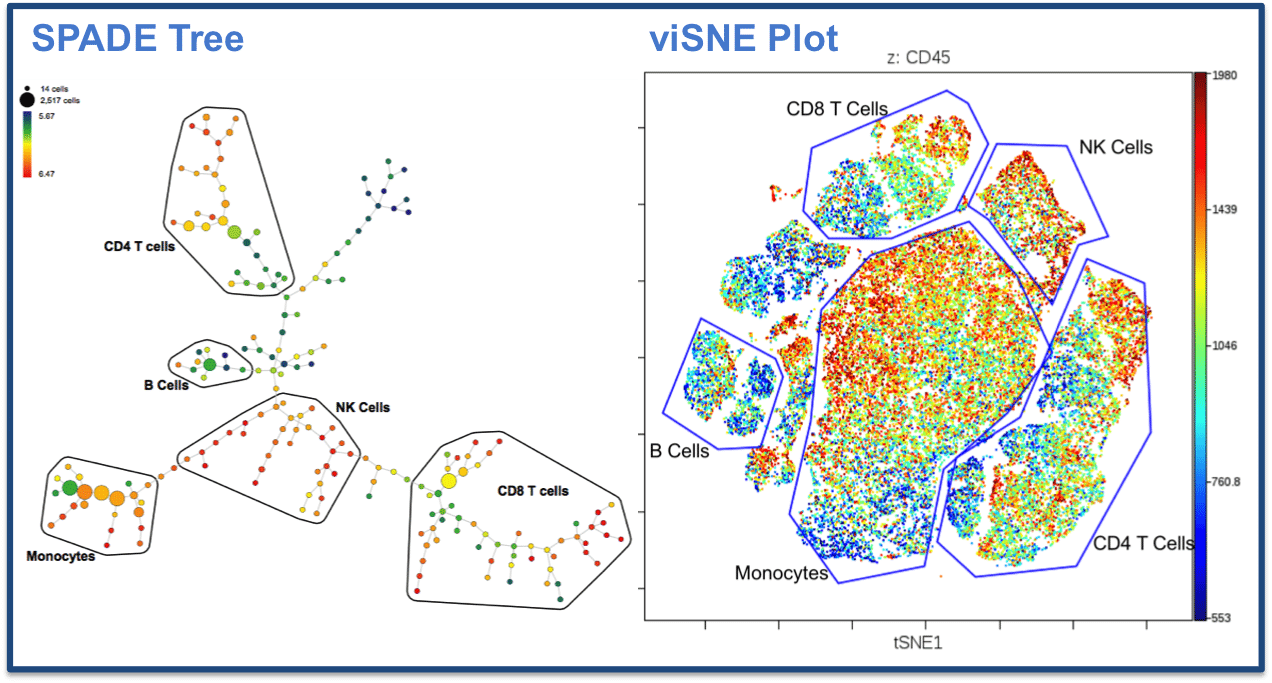
The discussion in this meeting was on how to best analyze the kind of multi-dimensional data generated by mass cytometry using CyTOF. Mass cytometry combines aspects of flow cytometry and mass spectrometry, using metal isotopes to label antibodies to allow staining with up to 40 metal probes per cell. As CyTOF technology is becoming more widely used, several groups have developed and published algorithms to help scientists analyze these multi-dimensional data in a way that is both biologically meaningful and easy to understand when displayed visually. Two such dimension-reduction, or so-called “clustering” algorithms are viSNE1 and SPADE2. The discussion had centered around which of these algorithms to use, whether to combine them or use them in a complementary way, and what types of data sets they are most suitable for, and whether the resulting clusters were consistent or different between the two programs. “In a way, it depends on how you approach your data – are you trying to answer one specific question, or do you want to do unsupervised analyses as a discovery tool?” Narges interjects “The types of analyses you’d do in those two settings are going to be very different”.
This brings up an important issue faced by both the newly growing field of mass cytometry, as well as the established field of multi-color flow cytometry or other disciplines that deal with large datasets, such as single cell transcriptomics: “What is the best, and most accurate, way to analyze and represent data?” In fact, this is something essential to science in all fields, I think to myself, remembering a publication in PLoS Biology I read last week3. As scientists, we always grapple with how to analyze and visually represent data, especially when there are several different, but equally logical ways to do so, and while dealing with increasingly complex datasets. The most important thing is to not unwittingly misinterpret data, which is why open, honest discussions such as the one we had yesterday are so important. Discussing your analysis methods, showing different approaches, explaining the reasoning behind each approach as well as the disadvantages of doing particular analyses with other scientists is essential to getting it right. In a way, getting lots of data is becoming more and more easy. Analyzing them correctly and presenting them in a coherent, intuitive way is getting more and more difficult.
- Amir, E.-A. D. et al. viSNE enables visualization of high dimensional single-cell data and reveals phenotypic heterogeneity of leukemia. Nature Biotechnology 31, 545–552 (2013).
- Qiu P, Simonds EF, Bendall SC, Gibbs KD, Jr., Bruggner RV, Linderman MD, et al. Extracting a cellular hierarchy from high-dimensional cytometry data with SPADE. Nature biotechnology. 2011;29(10):886-91.
- Weissgerber TL, Milic NM, Winham SJ, Garovic VD. Beyond bar and line graphs: time for a new data presentation paradigm. PLoS Biol 2015,13:e1002128.
 About me: My name is Christine, and I am currently working as a research specialist at the Ragon Institute of MGH, MIT and Harvard in Cambridge, Massachusetts. After my undergraduate studies in Oxford, I moved to London for my PhD and first postdoc. After 7 years in this magnificent city, I was ready for an adventure and decided to go to Boston for 2 years for a second postdoc. As love and science made me swap rainy London for alternately deep-frozen or tropical Boston, 2 years turned into 5 (and counting), and I decided to deviate from the traditional academic trajectory to work as a staff scientist (the rather fancy title of my position is research specialist). Most days, I sit with post-docs and other staff scientists over lunch or coffee, and discussion topics range from the inane to career goals and options, our research, new techniques and technology and the like. I would like to share some of those topics with you in this blog. Want to join in? Grab yourself a cup of your favorite caffeinated beverage, read along, and leave comments. You can read my other blog posts here.