Subscribe to our newsletter
Five measures that chart the rise of Chinese influence in global research

If the story of the 20th Century is one of the decline of the power and influence of the West, then the 21st Century tells the story of the ascent of Asia and more specifically China. Indeed, the era in which we live currently, with the cultural and economic dominance of the West, is something of a historical aberration.
A 2012 report from McKinsey points out that for the better part of the last 2000 years, the centre of economic wealth in the world has been firmly positioned in the East, with a period from the 1500s until 2000 where the centre of mass moved and dwelt (for a while at least) in the West. The enlightenment and the industrial revolution took place first in Europe and our own work shows the movement of the centre of mass of research since the late 1600s to present day – a journey that starts in the UK, moves West to the US, reaching its nearest point in the mid-1940s before moving ever more quickly eastward towards China.
This week’s Communist Party Congress will see it hand leader Xi Jinping an historic third term. If we were to assess China’s growth in non-research terms during his leadership, we might look at its financial output such as GDP at purchasing power parity (PPP), in which case you would notice that China overtook the US to become the world’s largest economy in 2016. In Rachman’s 2016 book Easternisation a framework for thinking about the rise of China is presented. While Rachman looks at the world through the lens of the Thucydides Trap (the Greek-inspired notion that when the pre-eminent nation in the world changes, there must be war between the incoming power and the incumbent) we take a different view in the context of research. Research leads to knowledge that should be the property of all humankind and hence, perhaps naively, we will take the view that the more countries that choose to invest in research, the better it is for all, since, so long as that research is done openly and made openly available, the more innovation and advancement is possible.
In this short blog, we propose a set of research-based measures to track the rise of China.
We propose the following set of metrics by which to rank countries to see how influential they are in the world of research. We have five metrics, in increasing importance and level of difficulty to achieve:
1. Percentage of GDP spent on research: Theoretically easy to achieve for most countries since this is mostly within the hands of the government of the day. It may be a leading indicator of research success but does not take in account the size of the economy, which is obviously a determining factor into how much difference this investment can make.
2. Gold Open Access (OA) publication volume: Slightly harder to achieve than metric 1 since it requires a change in culture and understanding of incentives. This is a stronger leading indicator of the increasing power of a research base.
3. Total publication volume: Highly related to metrics 1 and 2 – to consistently publish a large body of research content in recognised journals requires significant investment in both research infrastructure and capacity. But, also as the current trend is toward OA publication, also a significant investment in Open Access.
4. Proportion of global citations: Still harder, producing high research volume is not the same as producing research that is highly noticed, read and cited. Garnering citations is critical to demonstrate that work is noted.
5. Relative global influence: Using Eigenvector centrality, a network measure that can be considered a proxy for influence in an ecosystem, we calculate this quantity on the co-author graph. Broadly speaking this metric expresses the likelihood that a given paper picked at random from all papers in a given year has an author from a given country on it. It is not a probability but can be thought of as a related quantity.
This is necessarily a reduced list and focuses on highly quantifiable metrics. It does not assess the policy environment in a detailed manner – ease of cross-border travel and ease of access to visas for the purposes of collaboration, study and academic work are obvious ways in which a country can have a disproportionate effect on the research economy. It is also clear that attracting overseas students to study increases diversity at many levels and helps to create networks that can later result in fruitful collaborations – again, this is not something that we’ve considered here.
However, these five metrics are chosen to show causal development. From funding to being able to develop infrastructure and a research population together with the willingness to publish in Gold Open Access journals. This then leads to building a more substantial capacity that is able to produce the consistently high research volumes required for excellent research to be part of the overall mix. While citations are not a proxy for quality, high-quality work is often more noted and hence more cited. Ultimately, if there is funding and serious research worthy of note then this makes a country a destination for collaboration.
1. Percentage of GDP spent on research
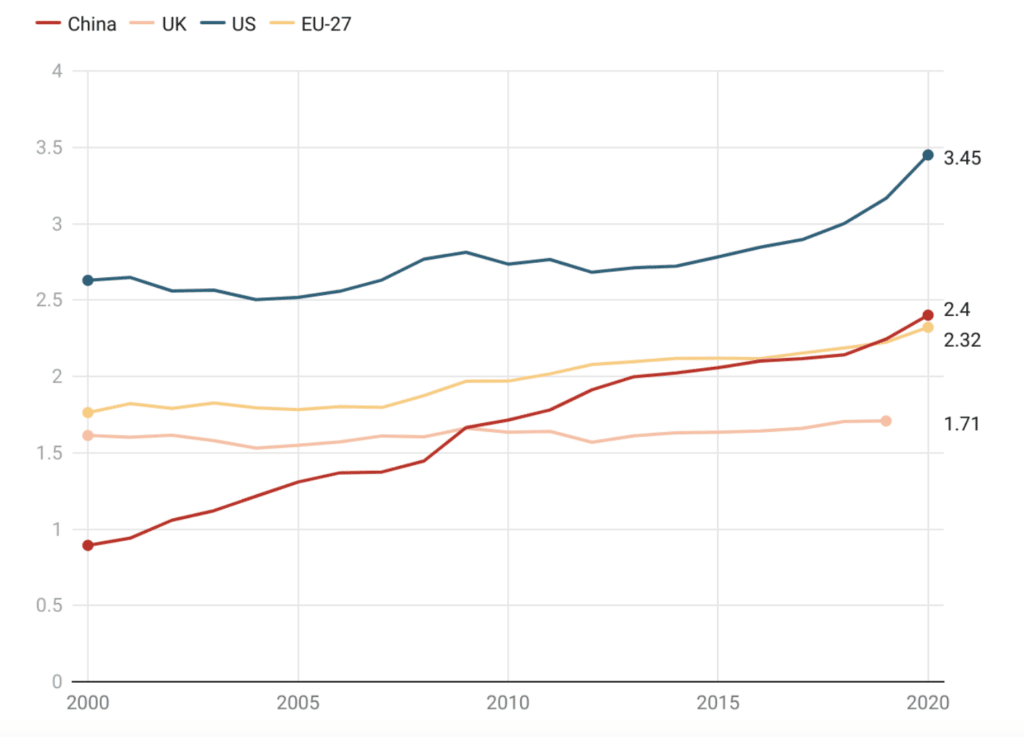
Looking at Figure 1, below, we can see that Chinese investment in Research and Development (R&D) has increased steadily since 2000 to reach 2.4% of GDP in 2020. However, since around 2012 the US has increased its own investment in R&D, a trend mirrored by the EU-27 countries. At the same time GDP at PPP has increased significantly for China. In 2021, China’s GDP at PPP was $27.3tn USD versus $23tn USD for the US, $21.6tn USD for the EU and $3.34tn USD for the UK. This means that the while the US still outspends China in absolute terms, the gap is narrowing between the two countries with China spending around 20% less than the US. If the Chinese and American economies continue to grow at their current rates (3.2% for China versus 1.6% for the US) for a sustained period, China would be spending more than the US on its research base by 2032 without the need to increase the percentage of GDP invested. Of course, China may see a slowdown given the current financial picture, but it has also been clear that the country is keen to invest in research and hence it may well be that China chooses to increase the percentage of GDP that it wishes to commit to its rapidly increasing research economy.
2. Gold Open Access publication volume
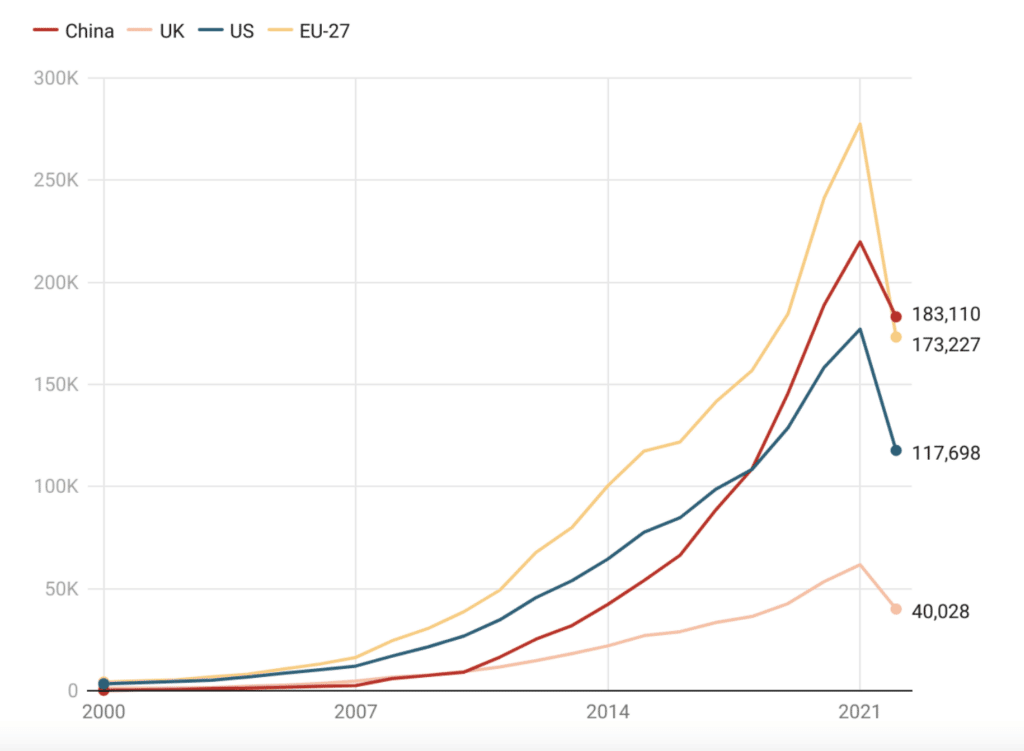
Advanced research economies have typically invested heavily in open models of publishing and sharing research in the last decade. The reason that we have focused on Gold rather the Green OA here is that Gold OA conflates two political components – firstly, the willingness to adopt policies to make research broadly openly available and, secondly, the ability to fund OA. Green OA, which is frequently considered a more progressive form of OA is often more difficult to track since funding for it is usually done through infrastructure, which is harder to track than Gold OA author processing charges. The UK has been a leader in Gold OA alongside countries such as Australia, Brazil and India. However, if we look at the main “blocs” – China, the EU and the US we see that the EU (see Figure 2) has historically been the most committed to supporting Gold Open Access, as can be seen in its overall volume. In 2009, China only equalled the UK in Gold OA volumes, but there is a clear inflection around that point, when China accelerated, overtaking the US around 2017, and looking to be on course for overtaking the EU this year (based on an extrapolation of partial year data).
3. Total publication volume
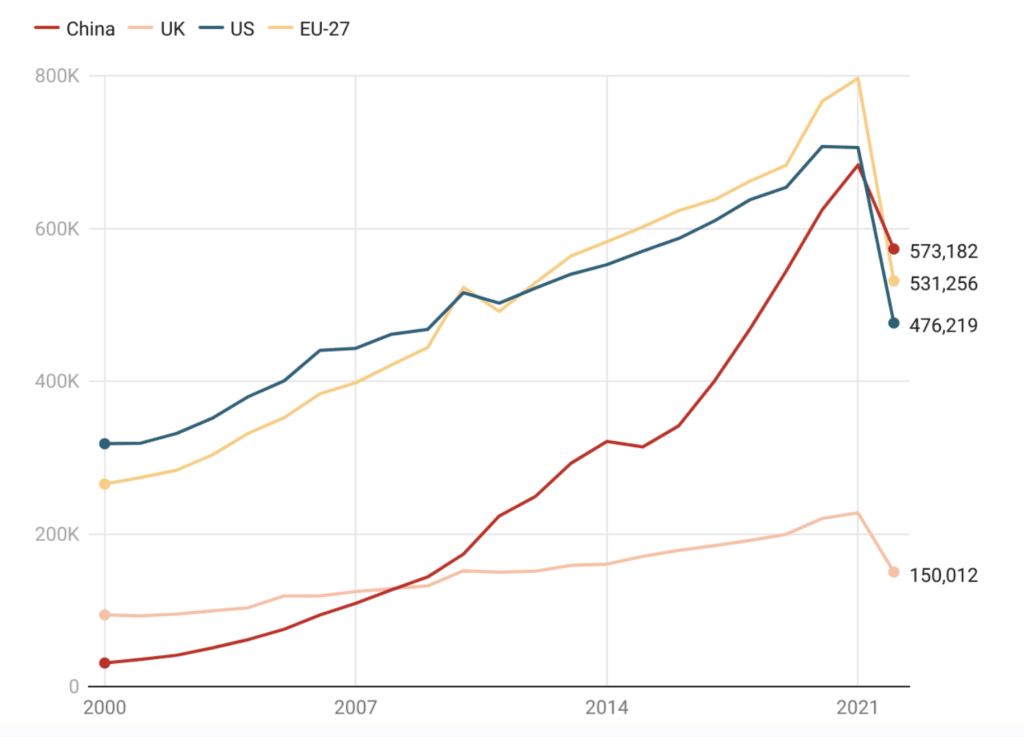
Another obvious marker of research development is the total volume of publications. This is harder to achieve than the previous two markers as a sustained high-level of production requires long-term development of infrastructures to support research, as well as feeder mechanisms such as training for undergraduates, PhD students and postdocs. It generally also requires a vibrant research community and opportunities to collaborate internationally (which is discussed further on). In Figure 3, we see that not only will China surpass the US this year but it also looks likely to leapfrog the EU in production volume.
4. Proportion of global citations
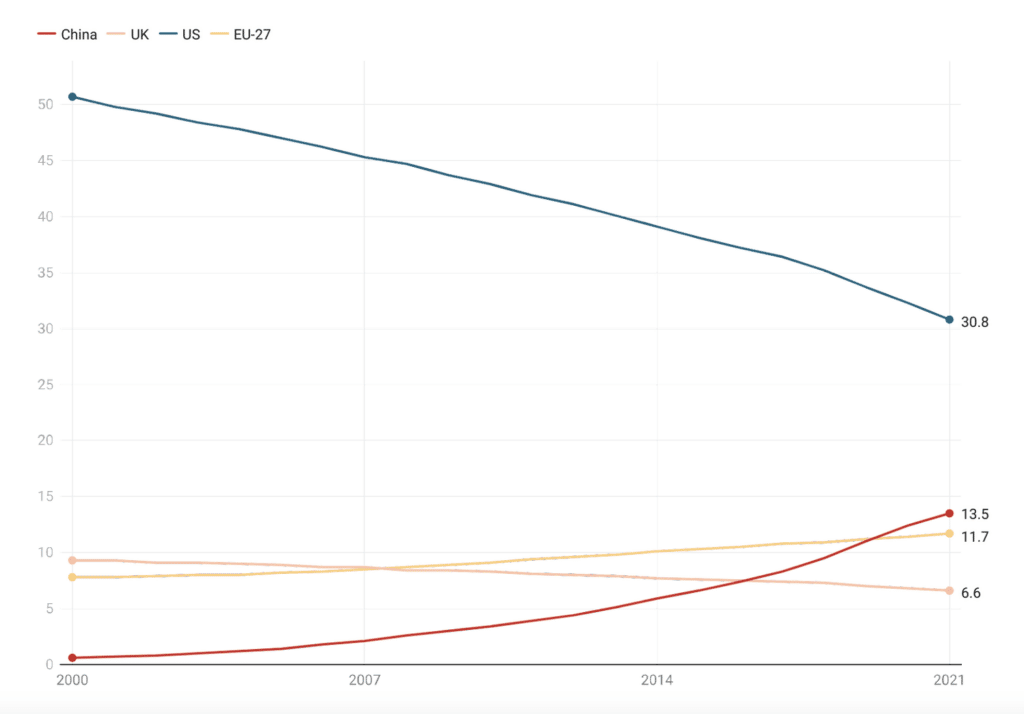
To be considered the preeminent research country, it is not merely about research volume but whether research is noteworthy enough to be cited. Since 2000, the research world has diversified significantly on the global stage with many countries beginning to play an active role in developing their research economies. As a result of this development the overall share of global citations garnered by established actors such as the US and UK has naturally decreased. The EU (as the old eastern bloc countries began to more seriously invest and develop) has grown its share. But, the big winner has been China, moving from a tiny single-digit share of global citations in 2000 to 13.5%, a level that is almost a full 2 percentage points ahead of the EU-27. While this is still dwarfed by the almost 31% attracted by the US, it is clear that China is producing a high level of very noteworthy research.
5. Relative global influence
Finally, we use a network measure called Eigenvector Centrality on the co-authorship graph to work out who the preferred partners are to work with by country (Figure 5). The EU-27 countries have continued to be the favoured research partner over the last two decades.This metric is heavily influenced not only by the large volume of papers produced by the EU-27 countries but also their strong links with other collaborators such as the US, UK, China and beyond. Of course, each individual country in the EU-27 will look significantly weaker on its own, however, there is significant power to be gained from being part of the bloc, as can be seen from the network effect highlighted here. Thus, coordinated funding streams such as Horizon 2020 have built an excellent platform for the research influence of the EU-27.
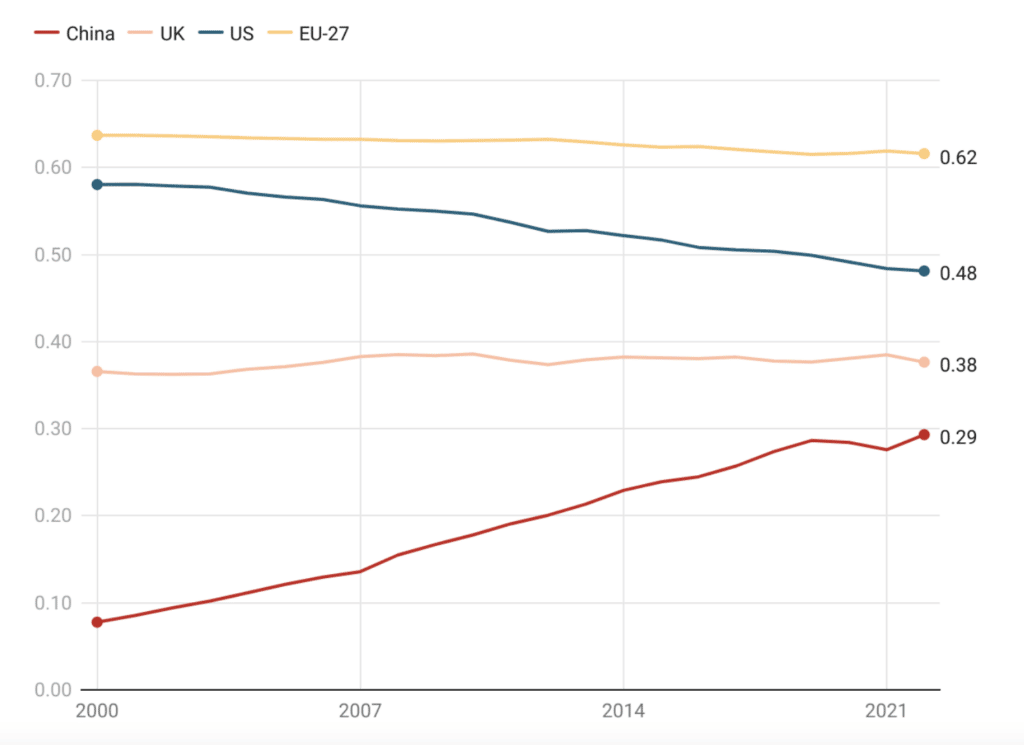
The relatively smaller size of the US together with its stronger internal collaboration network places it second in the list. The UK outperforms on this measure due to a number of historical advantages – its strong global connections through the Commonwealth; its past relationship and general geographic proximity to the EU-27; its historically strong relationship with the US; and the establishment of English as the global language of research. These factors all mean that the UK is something of a destination for students, who then either stay and create connections to their home countries or return to their home countries and continue to collaborate with their UK-based colleagues.
China, by comparison, has not yet had time to build a large and complex network of global collaborations. At the same time, it is growing its research capacity so rapidly that few countries have the absorptive capacity to work with China at the scale that is possible. That tends to imply that China’s research collaborations are currently more internally focused than might otherwise be the case where they too have developed to their current size more slowly. However, it is still clear that China is quickly developing into a highly collaborative global partner with scale.
This trend will be highly relevant for the scholarly communications industry. As the great and the good of academic publishing descend on Germany this week for the Frankfurt Book Fair, they are acutely aware of the rapid increase of Chinese research, and strategically one of their main challenges is how to attract authors to their books and journals and increase their market share of content. Given recent policy changes in China, traditional citation measures as represented by metric 4 and modern vectors such as metric 5 could combine to inform publishing strategies around, for example, how to encourage and facilitate global collaboration with Chinese authors.
Closing thoughts
Each one of the five measures gets successively harder to achieve pre-eminence and, in some sense, one leads to the next. A country can decide to spend a large amount of its GDP on research if it values research and believes in the long-term effects of that for its people. Of course, there are two aspects to this – government spending and industry spending. A government can encourage industry spending on research with the local tax environment and other inducements but, at the end of the day, this is also a cultural phenomenon. Those who believe in the value of research will generally invest. As a country becomes richer and levels of education increase, it is a choice often made to invest in research for future prosperity and for the long-term benefit of its people. Increasingly the richest companies appear to see things similarly.
Once a research economy is established, there is a clear value in sharing results through open access to increase the volume of material available upon which to build, which leads to metric 2. Of course, if a country is wealthy then paying for open access is also something that is within reach. But, more generally, it is important to have sufficient research volume that you can ensure that a proportion of that research is of high quality – an effect that only tends to happen at a certain scale of endeavour and hence metric 3 becomes important. As metric 3 is achieved, then the international community should begin to recognise the value of the research being produced and it should become more cited, leading to metric 4 and finally, in achieving high quality research at scale, the country becomes a destination for collaboration and gains influence in the global social research network, which is metric 5.
Thus far, China has established itself sufficiently in metric 1 that it has been able to achieve pre-eminence in metrics 2 and 3. (This development may be surprising to some as it was not obvious that China would overtake both the US and the EU-27 in the same year in metric 3!) Metric 4 tells a broader picture – that citation patterns are diversifying. It is not merely that the proportion of citations to the US is dropping and switching to China, but rather that the proportion of citations to the US is dropping in favour of greater geodiversity, of which China is one recipient. South America, and Asia in general are developing significant research economies, which is a positive trend. Finally, China’s development in metric 5 is impressive.
Within just a few years China’s global influence has developed to a point where it is clear that, if it continues on its current path, within a decade it will be vying with the EU-27 for global pre-eminence in its ability to influence the global research conversation.
About Dimensions
Part of Digital Science, Dimensions is a modern, innovative, linked research data infrastructure and tool, re-imagining discovery and access to research: grants, publications, citations, clinical trials, patents and policy documents in one place. www.dimensions.ai
About the Authors

Daniel Hook, CEO | Digital Science
Daniel Hook is CEO of Digital Science, co-founder of Symplectic, a research information management provider, and of the Research on Research Institute (RoRI). A theoretical physicist by training, he continues to do research in his spare time, with visiting positions at Imperial College London and Washington University in St Louis.

Simon Porter, VP Research Futures | Digital Science
Simon Porter has forged a career transforming university practices in how data about research is used, both from administrative and eResearch perspectives. As well as making key contributions to research information visualization, he is well known for his advocacy of Research Profiling Systems and their capability to create new opportunities for researchers.
