The Digital Science Speaker Series is a great opportunity for us to hear from the movers and shakers from across the research community, but let’s not forget that some of the most exciting innovators are right here within the DS Family, driving the development of a range of novel solutions to overcome research challenges. We thought it was about time we met some of those “doers” who are challenging the status quo of research.
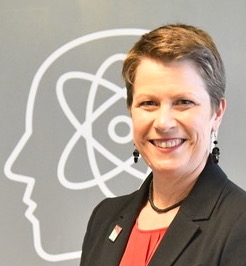
Kicking off our first Speaker Series Special we chatted with metaphacts at the launch of the Dimensions Knowledge Graph at BioIT World in Boston. Dimensions and metaphacts have combined forces to create a platform that helps democratise research data. We sat down with the CEO of metaphacts Sebastian Schmidt at metaphacts’ fringe social at SPIN Boston to find out more about metaphacts, metaphactory, and more.
Sebastian is not a researcher himself but it is clear that his background in IT makes him the perfect data-wrangler. He became acquainted with knowledge graphs back in 2008, and was an immediate early adopter and advocate of them, clearly seeing the value of organising data using knowledge graphs to make connections and gain actionable insights from otherwise disparate pieces of research information. In 2019, the founder and Chief Scientific Officer of metaphacts, Dr Peter Haase who had been an active driver and contributor in the Semantic Web space since 1995, sought out Sebastian to join metaphacts for his decades-long experience in IT and strengths in executive leadership. In 2023, metaphacts joined the Digital Science family and last week they launched their new collaborative platform. We wanted to find out more about what knowledge graphs are, what they are used for, and the impact they have on research.
What is a knowledge graph?
Knowledge graphs transform information into insights. They are a visual representation of data. Rather than confining information into the rows and columns of a spreadsheet, knowledge graphs create a navigable landscape to help users understand the connections and relationships between different pieces of information or different data types that all relate to one another. As Sebastian puts it, knowledge graphs are “an integrated system of knowledge”.
metaphacts’ technology takes this to the next level with semantic knowledge graphs – semantic models that don’t just make connections but also describe what is in that graph. These days, it doesn’t matter which discipline of research you work in – the wrangling of vast amounts of data and information is common across all fields of research. However, researchers are not necessarily trained to handle this much data. Sebastian understands this, but luckily with his IT background, he is well placed to help researchers translate information to insights, and crucially knows to deliver these insights in the language of the users and consumers of this information, rather than using jargon or poorly defined terms. In doing so, Sebastian and his team are making research information open and accessible to everyone, and democratising data.
Where do we encounter knowledge graphs?
Knowledge graphs already underpin many ways in which we already access information. Perhaps the most well-known use of knowledge graphs is the one that underpins Google’s search engine. The knowledge panel that appears alongside any Google search contains specific, structured information that closely relates to your keyword search and provides other related suggested searches that match your keyword. This functionality is powered by Google’s knowledge graph and works by identifying your keyword search term within a vast and interconnected landscape of information. By exploring the closest connections within this, it can offer a range of relevantly related pieces of information.
Knowledge graphs also exist in most industries and organisations now, helping apply a layer of structure to otherwise hard-to-connect pieces of information, though these can often remain as department- or function-specific pools of information. The ultimate goal is to make the most use of all data and bring it all together under one knowledge graph umbrella.

metaphactory
Data is amazing, but it isn’t knowledge until you can make sense of it by joining the dots, and drawing value from understanding connections between pieces of information. Sebastian acknowledges the challenge that this poses for research – as an IT professional he can see data and know how to extract what he needs from it, but this is not necessarily a skill that all researchers have yet. This is why we must create knowledge graphs with an intuitive user interface, to encourage and allow people not trained in big data wrangling to explore information. metaphactory creates user-friendly interfaces to lower the barriers to accessing information by making it easier to form queries to explore knowledge graphs.
metaphactory also provides a way for users to model information, which is a new skill for many researchers. This is especially useful if you can bring together all the information relating to an organisation or institution. However, things can get easily lost in translation between business segments, with one department using one definition of a word and another department having a very different definition of the same work. This is where metaphactory can also help, as it offers actionable insights to users in the language of their own community of practice, helping eliminate misunderstandings and boosting productivity.

Knowledge graphs for research integrity and horizon scanning
More research is being published than ever before, and with it more active campaigns of inadvertent mis- and deliberate disinformation. Knowledge graphs can help identify credible and trustworthy research that can be cited and built upon by helping understand the context around a piece of work.
Knowledge graphs can also be used to spot emerging trends within different fields of research. They do this by identifying concepts in core statements and core findings and have the added benefit of helping users understand how these new areas are connected with existing areas of research, and how resources can be best utilised to pursue these new and emerging areas of exploration.
Accelerating research and discovery in the age of AI
A lot of research information is held in subject silos, with one area of research being unable to easily access or explore knowledge in other areas. Knowledge graphs help to break down the barriers between these silos of knowledge and make connections between different areas of research that you could not otherwise necessarily identify.
Knowledge graphs also help you explore information to help you find what you didn’t know you didn’t know. With a traditional keyword search, queries are only as good as the prior research you have already carried out. By taking search beyond keywords and into the realm of semantic knowledge graphs and the identification of concepts alongside ontologies, the results offered are relevant, but also related in terms you may not have included in your search query, that you may not yet have come across and could have potentially overlooked as a result.
Knowledge graphs also provide a perfect foundation on which new technologies can be responsibly built. This is because knowledge graphs are built by subject matter experts, and so by identifying concepts in a field and making connections between them, they can enable other machine-learning systems to more accurately build knowledge from data.
Democratising data with Dimensions Knowledge Graph
With their latest collaboration, metaphacts and Dimensions have joined forces to leverage the immense amount of information brought together within the Dimensions platform using metaphacts’ knowledge graph building potential. In doing so, they have enhanced the understanding of connections across one of the largest resource banks of information and can provide a range of insights from across the entire research landscape with an intuitive and user-friendly interface. In doing so, Dimensions Knowledge Graph is supporting the democratisation of data.
This is important as so much research is publicly funded, and many of the global challenges we face can only be overcome through collaborative and interdisciplinary innovation. By breaking down the barriers between silos of information and showcasing connections and relationships across a broad range of data sources and fields of research, Dimensions Knowledge Graph can support research and development for all.
In an industrial context, this becomes an even more exciting tool, as organisations can combine their own internal data into the broad corpus of existing research information and better understand how their novel innovations align with and build on the rest of the research landscape, and what other connections can be gleaned from their discoveries.

Catalysing collaboration
Researchers in life sciences have long understood that to accelerate their research, it is smart and strategic to collaboratively work across their industry to build a strong foundational base from which to elevate everyone in the industry. Big challenges can only be overcome with a lot of informational input, but the more information you have, the more you require a strategic method of gathering insights. One example is the Human Genome Project, a collaborative development that has enabled a huge amount of novel research and development in the life sciences.
The industry’s early investment in information infrastructure is paying off, as demonstrated by the development and open sharing of frameworks such as subject-specific knowledge graphs for the industry that all researchers can build on. In doing so, the industry is accelerating the innovative potential of their community, and increasing the rate of translation of research information into real-life impact. This can help shake up research and development, and help people in organisations better understand the work going on across different business functions, saving resources such as time and money by avoiding duplication and streamlining activities.
Strengthening data citizenship in the research community
Not all researchers are trained data scientists – however the sheer volume of data across all research areas is growing, and data wrangling is a useful skill to share across the community. To utilise data to inform future research, we must ensure that the information we put into the world is as useful as possible and that researchers feel confident in contributing to and interrogating the world of research information to gain knowledge and insights.
One way we can achieve more impact through the work we contribute and build on is to have an appreciation of how good metadata is key to driving the extraction of knowledge from research information. Cross-segment community engagement training initiatives can help researchers build confidence in understanding how the structured metadata they use to share their research outputs can drive the inclusion of that information into knowledge graphs, supporting better discoverability and sharing of research information with the whole research community.
The metaphuture
Sebastian believes that the future of research lies in the organisation and use of structured information. He also believes that we will be diversifying the way that we publish and cite research outputs, observations and claims, perhaps through the more widespread adoption of data sources such as nanopublications.
Sebastian also hoped to continue to develop technological solutions to accelerate research and discovery through the community-led development of tools and ensure that the user interfaces of new platforms for research are as intuitive as possible, in order to continue to democratise research data for all researchers and research that ultimately positively impacts society.
Check out our Speaker Series playlist on YouTube which includes chats with some of our previous speakers, as well as our TL;DR Shorts playlist with short, snappy insights from a range of experts on the topics that matter to the research community.
With thanks to Huw James from Science Story Lab for filming, photographing and co-producing this interview and event. Thanks also to SPIN Boston, MA, USA for hosting the metaphacts social and to Sebastian for his time.


